PDSA Cycle
X
GO

Successful Strategies for Improvement
This toolkit will provide you with examples of ways to improve your quality and patient safety processes and outcomes. As with any improvement method, it is important to define why you are initiating the improvement tactics and what are you trying to accomplish. Don’t be afraid to develop small tests of change. Often small tests of change can be meaningful and prevent staff or those affected by the change from becoming overwhelmed. 

The following paragraphs will define each stage of the Plan, Do, Study, Act (PDSA)* cycle of improvement. This cycle is a basic tool that can be used in both simple and complex performance improvement plans. 

ImplementingThePDSACycle636513068783837462

The Plan Phase of PDSA

The first step in planning any improvement is determining what you are trying to accomplish. Often, as in the case of the MBQIP measures, you are being guided towards what you are trying to accomplish, e.g., vaccinate 100% of eligible patients for influenza.

Forming the team

Whether the improvement opportunity is mandated, or an initiative by your facility, gathering a team of key stakeholders and leaders is essential for effective planning and implementation. These key stakeholders are often frontline staff and providers.
When forming your team don’t forget to include at least one member of senior leadership. Additional team members often consist of people or departments who can impact the success of the desired performance. For example, if you are trying to implement 100% compliance with flu vaccination administration by your nursing staff, it is important to include pharmacy in this effort to ensure access to the vaccine for timely administration.
In critical access or rural hospitals where staff members often assume multiple roles, you may find it best to create process improvement teams using the Hub and Spoke model. This model allows for a central or core quality improvement team where additional members or stakeholders can be added depending upon the subject. For example, a respiratory therapist (RT) may not serve as a member of the core team but when trying to improve ED length of stay for patients with respiratory illness, an RT would be helpful. The diagram from the Stratis Health guide more accurately demonstrates this effort.

StratisHealthHubAndSpokeModel636513085334118142

Asking What?
The “what” is often referred to as your overall goal or outcome metric. During the planning phase of the PDSA cycle you will establish the metrics for success. You will evaluate the data from these metrics in the study phase and then determine if changes or adjustments in any process metrics will help you more easily attain your outcome goal. You will need to determine your overall outcome goal and metric and then determine the process or steps to successful implementation and measurement. The example of outcome and process metrics are further defined in the following paragraph.

1. Outcome
a. Provide flu vaccinations to 100% of eligible patients.
2. Process
a. Screen 100% of patients for flu vaccination within 4 hours of admission.
b. Flu vaccination is available on the unit 100% of the time.

Asking Why?

The reasons to improve processes and outcomes are many, but here are a few to consider:
1. Better patient care
2. Better reimbursement
3. Increased efficiency
4. Monetary savings

Asking How?

To gauge success of your efforts towards improvement, you will want to establish process metrics. Process metrics are ways we can track smaller components or “how” you will improve to attain your desired outcome.

By tracking process metrics, you and your team can more accurately identify where in the improvement cycle an error is most often occurring. This information will help you identify where in the process the error or breakdown is occurring.

Remember, your initial educational roll-out may only be directed toward a pilot unit or an area of minor change. When the improvement team moves into the Study phase of the PDSA cycle they can evaluate the effectiveness of the education and make any necessary changes.

The Do Phase of PDSA

Once you have developed a plan, the next phase is to implement or “do” the plan. This phase can be small increments (small tests of change) of the overall improvement plan or goal. You may also choose to implement the plan on one unit or department to test the outcome. Staff education and effective communication is crucial for improvement even when implementing in one unit or department. Education for physicians and staff must contain (Please see following section):

a) which patients need screening through established criteria
b) how to follow up or respond to patients who refuse the vaccination

It is also important to make sure you include the process metrics in this phase. One of the most frequent errors in measuring the effects or results of change, is failure to link the implementation to the plan. When the linkage is not clear, you will not know which change is impacting your outcome.

Outcome: Provide flu vaccinations to 100% of eligible patients for each nursing unit

Process Metric #1: Screen 100% of patients for need of vaccination for each nursing unit

Without development of a process metric to measure screening of patients, it would be difficult to attain your goal of 100% vaccination. Education on patient screening is key to success.

Staff Education

An important part of the planning phase is educating staff and even physicians when necessary and appropriate. As you develop your education plan, determine critical elements to relay to staff and/or physicians. Change is often difficult. Including informal leaders as change agents is a helpful strategy.

You should never rely on education alone when implementing change. Organizing your education plan and communicating the plan to staff, is vital to its success. Providing staff with the situation, background, current assessment or metrics and the planned change or recommendation, is essential to gain the greatest buy-in. As you read this section of the tool you may have noticed the use of the terms associated with the acronym SBAR.

Your facility may already be using SBAR for nurse to physician communication, but using SBAR to communicate improvement efforts or other pertinent information to staff is an excellent way to organize thoughts and promote educational awareness. The SBAR communication can be as detailed as you’d like. The following example provides you with a simple outline on how to communicate the changes and the rationale for the changes. This form can be posted on the unit or for increased ownership. Leaders can ask each staff member to read and sign as a method of education. (See Sample SBAR-Appendix A)

The use of this form can be used when conducting a small test of change within one unit or department, or when implementing a new process across the hospital.

SBARCommunicationExample

The Study Phase of PDSA

During this phase of the PDSA cycle, the team should evaluate the data and determine if changes in process steps or education are necessary to more effectively reach the outcome.

The Study phase of the cycle helps the team make timely decisions. It is always helpful to look at process data concurrently. Process data can be measured or monitored in several ways. Some of the most common ways are through use of checklists, direct observations, or audits. Concurrent data is discussed in more depth throughout the following paragraphs.

Collecting, reporting and analyzing data concurrently can provide significant improvements to quality performance. Other benefits are:

1. Preventing an error from “reaching the patient”.
2. Preventing delays in CART data entry.
3. More quickly identifying gaps in structures and processes.

What is Concurrent Data?

For the purposes of this toolkit, concurrent data collection and its benefit to improvement is defined as data collected within 3 timeframes categorized as listed below. The value of the data for improvement opportunities are further categorized within these timeframes. However, it must be stressed that concurrent data allows an organization to “catch” the opportunity to address or fix a problem in real time. Through the collection of concurrent data, one can even address the issue before the patient gets discharged.

ConcurrentDataAndTimeframeCategorization

Outcome data can be examined less frequently than process data. In other words, on a weekly basis with outcome data, you may look at whether 100% of your eligible patients are receiving flu vaccinations, while with process data, leaders may want to examine if patients are being screened on each shift.

The Act Phase of PDSA

This phase of the PDSA cycle is where the team implements any changes to the initial plan. Following the Act phase, the PDSA cycle starts over until the outcome has been met. Your team may decide to change some of the process steps to better measure or track performance. Additions to staff education or other methods to promote staff ownership and accountability of the new process could be implemented.

Keeping Track of Progress

In every improvement plan, it is important to track progress, assign responsibility and identify barriers to success. Please see the Sample Performance Team Agenda and Minutes worksheet your team may find useful. (See Appendix B)

Additional Tools and Resources for Performance Improvement, Teamwork and Staff Engagement

Below are descriptions of tools for use in more complex situations or when you feel you must “dig deeper” into actual or potential problem. Use of these tools in performance improvement can be help to more accurately determine which issues are causing poor compliance in a quality measure. Another useful source for learning more about performance improvement tools is the Centers for Medicare and Medicaid Services (CMS). Lastly, Stratis Health (stratishealth.org) is a non-profit organization with a mission to support quality and performance improvement. Stratis offers a team of experts and several on-line resources to help you further develop your organization’s plan for quality and ongoing performance improvement.

Huddles

Huddles are an excellent way to engage staff in performance measures, provide immediate feedback and instill a sense of comradery for success. Huddles are a structured “stand-up” meeting with a central focus, usually around quality, patient safety and/or discharge planning.

Huddles should be daily, brief (no more than 15 minutes), have a set agenda, and be held with core members of the team who are empowered to solve problems. Typically, huddles are led by the manager or senior leader. The leader can remind the group of the main topics and then proceed around the table for issues/problems. The key to a successful huddle is for each issue identified to be assigned an owner responsible for follow-up. Huddles should provide an opportunity to “look back” to solve any issues from the previous day and “look forward” to help prevent any failures. The roundtable reporting should be done by exemption only with each participant in the roundtable responding with a report or either with “no concerns” or “nothing to report”.

Just as with any other plan, you can establish metrics around your huddles to determine if the process is helping you with the overall improvement plan. (For example, your team might decide that huddles would be a helpful process in reaching the outcome goal of 100% flu vaccination on 100% eligible patients. To help measure the effect of this intervention your team sets process goals around the huddle.)

1. “We will have daily huddles before 10am 90% of the time by January 15th”
2. “All clinical departments will be represented at the huddle.”
3. “The huddle will last no more than 15 minutes.”
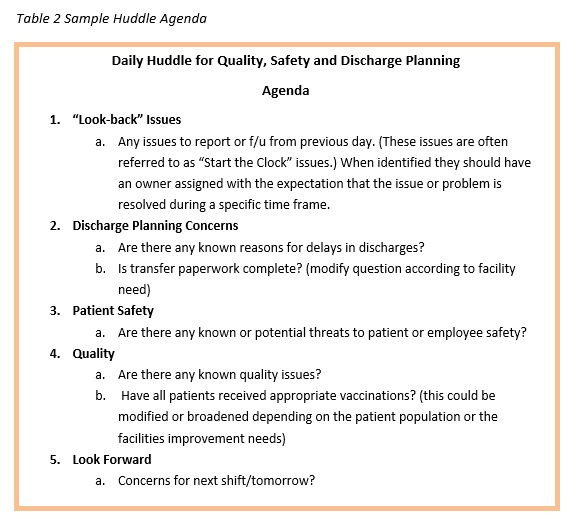
SampleHuddleAgenda

Staff Incentive Program

Many facilities have decided to link quality performance to the staff member’s individual job evaluation. Examples of linking quality performance with employee performance are:

• incentives for staff when performance is met; or

• evaluating the employee on the number of successful screens or evaluations.

Understanding Errors and Near Misses

It is essential that errors or near misses are included in data collection and reviews. Errors are typically those incidences that reach the patient and near misses are events that are caught and corrected prior to reaching the patient. Your facility may decide to track errors and near misses through your event or incident reporting system and a Root Cause Analysis may be performed. Near misses should be carefully reviewed since these types of mistakes can often provide great insight into problem-prone errors and when reviewed, can help to prevent an actual error from occurring.

Root Cause Analysis (RCA)

A root cause analysis (RCA) is simply a process to help caregivers, quality leaders and physicians determine how an error occurred. We often think most about doing an RCA when a major or serious safety event occurs but, an RCA can be done for any error. It may be especially important to perform an RCA on an error or near miss that has occurred more than once to prevent recurrence.

If you have been performing RCAs at your facility, you may be performing these by gathering a group of individuals around the table to discuss what happened. Interviews conducted by a quality leader prior to the team coming together to discuss and develop an action plan can be a more time efficient method of performing an RCA.

Failure Modes Effect Analysis (FMEA)

A Failure Modes Effects Analysis (FMEA) is an excellent tool for evaluating potential problems when a new or revised process is being implemented. A FMEA process determines occurrences and helps a team assign levels of risk or impact to the success or desired outcome of process. The Institute of Healthcare Improvement (IHI), has numerous resources in its QI Essentials toolkit. This toolkit is available for free at www.ihi.org by creating a log-in identification.

Fishbone Diagram

The Fishbone Diagram, (Appendix C), demonstrates a clear explanation of the advantages of considering people, processes or equipment impacting the team’s ability to meet defined goals.

Toolkit Appendices:

Appendix A - SBAR Sample

Appendix B - Sample Performance Team Agenda and Minutes

Appendix C - Fishbone Diagram

Additional Resources:

Little River, QA, PI Loop Enclosure